
The goal of this blog post is to help product managers who work in the Saas business to get better insights from their analytics tools. The post is based on my experience as a product manager and includes some useful tips to save you from typical pitfalls along the journey to better analytics.
This is a personal blog. This blog does not represent the thoughts, intentions, plans or strategies of my employer. It is solely my opinion.
I’ve been at Clarizen for about 2 years now, on the side of customer success and recently changed roles to join the product team. A few months ago, I transitioned into my role as director of Product, and since I started I began looking into analytics about user behavior.
Many Saas products face similar problems trying to understand the root of many different factors which affect churn and and adoption. While there are many tools that try and help answer questions about customer churn and adoption, there is no magic wand that can provide the answers to all of the questions which typically arise in this type of investigation.
The first problem I encountered, was how I could get a clear picture of what our users are doing in the system. To better understand our customers, I needed to know what features of the products they used, how often they used them and even more important, what they features they weren’t using at all.
Analytics tools
As I started to ask more and more questions, I learned about the different tools which were already used, including: Google Analytics, Totango and Gainsight. While we already had tools for customer analytics and user analytics, there were many limitations that kept us from driving insights using the tools.
A few months into the role, I learned that Segment was about to be implemented so that our Gainsight usage module can be enabled. That was the first time I heard about Segment, and my curiosity was piqued as to what other metrics we could use to get better business insights.
Analytics Limitations
I encountered 4 limitations/constraints in regards to analytics tools:
- Specific integrations
- Google Analytic sampling
- Mobile analytics
- R&D Load
Specific Integrations
One of our main problems was that until the Gainsight analytics integration, each analytics tool had its own specific integration, which meant more code to maintain and more work in the case of changes. I was happy to learn that the infrastructure for a Segment connection was laid out already a year ago after one of the developers heard about the tool. In case you have not heard about Segment, let me give you a quick overview. Segment simplifies analytics by collecting customer data with one API, sending it to hundreds of tools for analytics, marketing, and data warehousing. Instead of spending hours manually connecting each tool using a specific integration, with Segment you can connect your application once and you’re set. From that point onward, you can start connecting to other analytics tools with no additional effort and without writing any code. I highly recommend anyone who wants to start experimenting with different analytics tools, start by implementing Segment.
Analytics Sampling
Like most companies, we use the free version of Google Analytics. While the out of the box reports are useful for understanding user analytics on a high level (# of Active User, # of pageviews, # of events… ) the problems start when you want to run more specific queries. GA’s free version is limited to up to 10 million hits(events) per month per property and sampling occurs automatically when more than 500,000 sessions occurred. Unless you want to pay 150,000$ for the GA Premium version, I would recommend to think twice about what events your send to GA. The need to carefully select the events to be sent, requires Product Managers to plan in advance all of the metrics they would like to track.
Mobile Analytics
After dealing with the issues of GA sampling (Basically by using it only for OOTB reports) and using other tools for event tracking (such as Heap Analytics), then came the mobile issue. Everyone in our R&D was very excited about Segment as it saved them time by not needing to code any new integrations. When we started looking into Mobile analytics we discovered that not all analytics tools support mobile integration through Segment. For example, both Heap Analytics and Totango support web analytics through segment, but do not support Mobile integration. This means R&D would need to manually connect the mobile app both to Totango and to Heap Analytics. When you evaluate your analytics tools, make sure to look if they support Mobile analytics integration through Segment.
Load on R&D.
In most cases, R&D needs to be involved for every new event to be sent from your application. If a product manager wants to track a new user behavior using an event, the product manager would need to ask a developer to add the event. The developer would need to pause her work, actually developing the application and its new features, and focus on sending analytics events. This reality causes distraction on the R&D side and it is not an optimal situation for either side (Product and R&D). Tools such as Heap Analytics allow product managers to choose what events they would like to track on the fly using a visualizer module that is easy to use. The server responses are saved, and every time a new “event” is created Heap knows how many events occurred last week by scanning all of the server responses. What this means for Product, is that you do not need R&D every time they need a new event.
Setting up the infrastructure
Good analytics requires proper foundations. Here are some tips to be aware of when building your analytics infrastructure:
- Connecting to Segment
Segment should be your first step. After creating an account for Segment, I recommended creating two different workspaces, one for development and one for production. We originally started with one workspace only for production. After testing some new integrations we encountered some JavaScript errors that affected our Production environment. The lesson learned is to always test new analytics integrations or new events in the development environment because making changes in Segment actually changes some of the JavaScript code in your application.

- User/Group Traits
Once the connection is in place, try and send Segment as much data as possible about the users and their accounts. Additional user traits could be: User Type, User License and etc. Account traits could be: Account type, account edition, Company size, Vertical, Industry, Version, Solution and etc. You can learn more about sending additional traits to Segment in two links: user traits, group traits. Adding more traits provides more options to slice and dice your data later on.
Top of the funnel analytics with Google Analytics
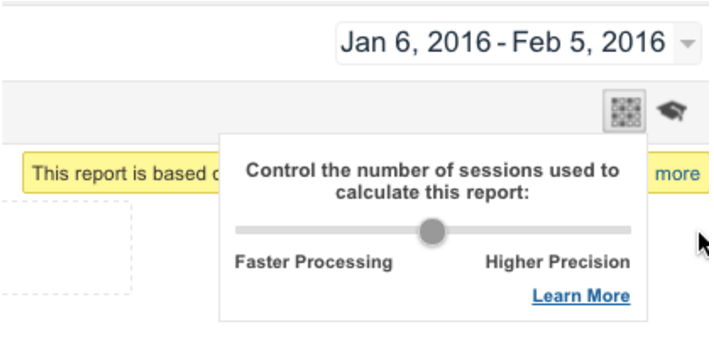
As an inbound product manager I’m less interested in marketing and acquisition analytics such as top users sources/adwords and etc. I use GA mainly for pageviews, top events, active users, and also to triangulate results with other tools- in our case Heap. In case you run an ad-hoc query that includes more than 500,000 sessions, GA will sample the results. To make sure the reports you generate are as accurate as possible, I suggest to always modify the precision vs processing for high precision as can be seen in the picture below:
User Behavior Analytics with Heap Analytics
When working on a new feature, the activity team should think about what metrics to track in the new feature. The conversation usually starts with questions like: “How many users actually click on this button?” or “How many users go to this page, from there to the other page and then click on that button/menu?” The complexity of asking these kinds of questions, is that you usually do not have events configured to answer these questions. This is where Heap comes into the picture.
The main advantage I find in heap is that you do need to think in advance of all the events you want to track. All you need to do is to use the visualizer, click on an element on the screen and define it as an event. Heap will automatically calculate the number of times users clicked on the element in the last X days.
The flexibility that heap provides by selecting events on the fly, makes the life of the product manager easier and frees R&D resources to focus on development.
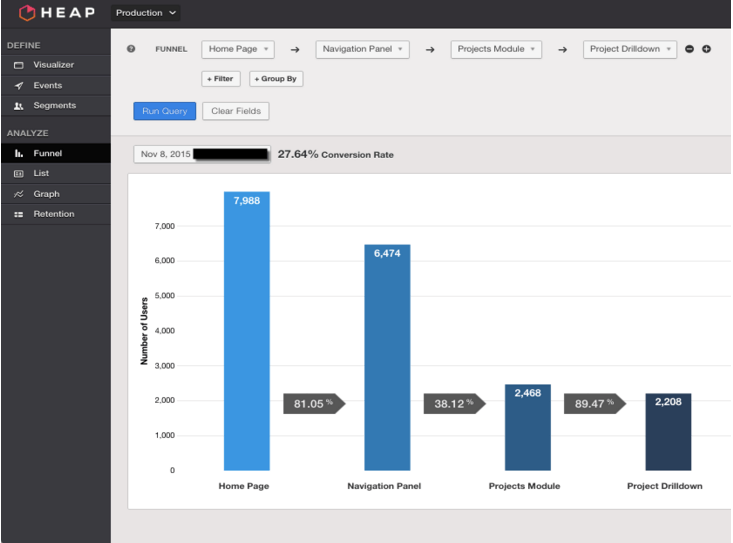
The way I suggest using Heap is to make an assumption as to what should be the user journey. After you have a clear user journey in mind, validate the assumption using a funnel chart. Let’s say the assumption is that a user lands on the homepage of the application, from there the user clicks on the navigation panel, then the user clicks on the project modules and selects a specific project. It would be interesting how many users actually go along that path and how many drop and where they drop. You can see the result in the screenshot below.
Customer Adoption
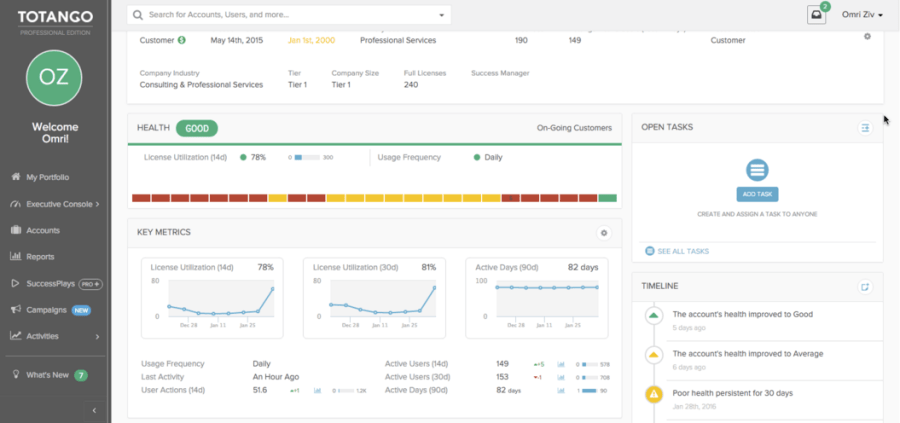
While user behavior analytics is usually done across customers and segments, customer adoption analytics are used per customer. For customer adoption we use both Totango and Gainsight. In Totango you can see the number of active users per customer, % license utilization, most common activities, which users login and more.
It is important to understand the basic metrics in customer adoption. I recommend reading Totango’s explanation of their core metrics: Engagement score, usage frequency, time spent, active users and license utilization.
In the picture below you can see an example of a customer that just finished their onboarding process after setting up the environment for a few months. The spike in the line chart represents the increase in % license utilization.
Gainsight provides similar usage data that shows popular activities and active users in the last 7 days.

One could ask why we need two systems that track the same customer metrics? When it comes to data analytics, triangulating the data makes you more confident in your data.
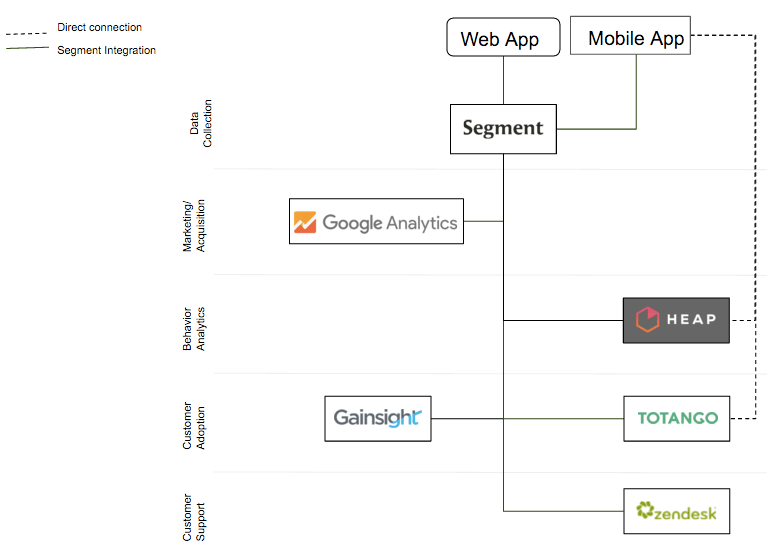
Considering the current integration limitations of the tools mentioned before, the Analytics infrastructure architecture will be based on the picture below:
Next Steps
The next steps in our data maturity would be to move towards a Data Warehouse using Amazon redshift. Having a DWH would allow us to move from understanding what happened, to understand why things happen and become more proactive. One of our main challenge is to find the most impactful parameter for churn/expansion. Once we have all of the data in one place, we can start running some statistical models (linear and logistic regressions) to find what the main factors are. There are all sorts of tools for logistic and linear regressions, I’m planning on starting with Gretl or R, both open source software packages for statistical analysis.
I hope you found this post useful and I’d more than happy to hear about the different tools you use for your Saas analytics.

Hey, thanks for sharing.
We are using Pendo for tracking feature usage. This tool doesn’t require defining events up front. Simply tag a button/link in your app, name it, and all usage data from the moment the tool was installed will populate.
We are also using FullStory. Though not exactly an analytics tool, it allows you to actually watch how your users are using the system. Each user session is “recorded” and you can just sit and watch whay they did. It integrates with Zendesk, so for every ticket you can see what the user did befofe/after submitting the ticket.
Would love to hear your thoughts.
Shai
LikeLiked by 1 person
Thanks Shai!
Will definitely check the tools you mentioned in our development segment workspace 🙂
LikeLike
Omri – thanks for the shout out for Totango.
LikeLiked by 1 person